Excel Dashboard AI (www.exceldashboard.ai) is an AI-powered data reporting assistant built to help professionals worldwide save up to 90% of their reporting time.
We automate the entire workflow—from Excel data ➔ analysis ➔ report generation ➔ PPT delivery—empowering users with McKinsey-level data insights and presentation capabilities. In just 3 minutes, our AI can generate over 20 pages of polished, professional-grade reports in PPT or Word format. Trusted by 60,000+ users worldwide.
This is the 4th launch from Excel Dashboard Ai. View more
Excel Dashboard Ai
Launched this week
From Excel to 20 Pages of McKinsey-Level Report—In Minutes!
Excel Dashboard AI now automates the full workflow in just 5 minutes:
Data Cleaning → Insights Generation → Visualization → PPT Report Creation, you’ll gain McKinsey-level data storytelling skills, without spending hours crunching numbers.
We’re excited to let you know that Excel Dashboard AI 2.0 is officially live!
This is our biggest upgrade yet — redesigned to make data reporting smarter, faster, and more powerful than ever.
🔍 What’s New in Version 2.0?
✨ Brand-new UI for a smoother experience
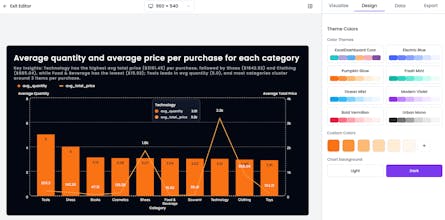
✨ AI Smart Editor to fine-tune insights instantly
✨ Visual Chart Editor for customizations
✨ One-click generation of 20+ page professional PPT reports
Whether you’re working with Excel or CSV, Excel Dashboard AI now automates the full workflow in just 5 minutes:
Data Cleaning → Insights Generation → Visualization → PPT Report Creation
With Excel Dashboard AI, you’ll gain McKinsey-level data storytelling skills, without spending hours crunching numbers.
📊 So far, we’ve helped over 60,000 global users, with:
• 350,000+ charts generated
• 50,000+ reports created
🌟 Special Gift for You:
We’re offering 250 free AI tokens to all returning users who log in today.
Plus, you’ll receive 60 free AI tokens every day just by logging in!
👉 Try the all-new Excel Dashboard AI 2.0 today and see what you’ve been missing:
🌐 www.exceldashboard.ai
Let AI handle the heavy lifting — so you can focus on what matters most.
This is honestly the most useful AI I’ve seen for data reports. Editing the content or changing charts is really easy, and the style is clean and professional. Plus, it’s super fast. Most other AIs just give you some image or HTML report you can’t actually use — this one’s way more practical.
Excel Dashboard Ai