
Oh Dear!
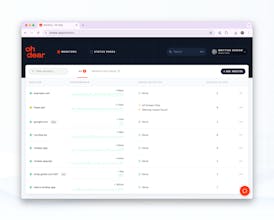
Oh Dear! monitors your entire website,not just the homepage.
298 followers
Oh Dear! monitors your entire website,not just the homepage.
298 followers
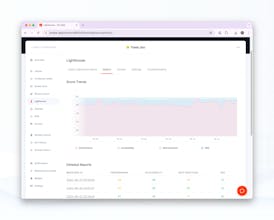
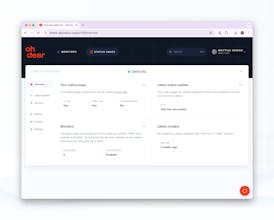
Complete website monitoring: from multiple locations, broken links & mixed content detection & advanced ssl certificate reporting.
This is the 3rd launch from Oh Dear!. View more
Oh Dear
Launched this week
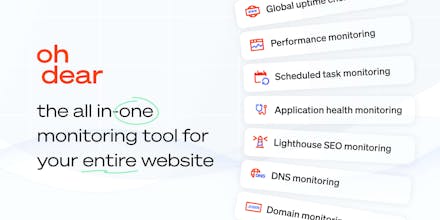
The all-in-one monitoring tool for your entire website
Free Options
Launch Team / Built With


Oh Dear!
minimalist phone: creating folders
Guys, you nailed the naming of the tool. This is what creative marketing looks like :)
minimalist phone: creating folders
I think that I fell in love with your marketing team :D
Oh Dear!
Haha thanks@busmark_w_nika ! 😁
We came up with the name while we were having a drink, we all ordered a beer called "Moeder Overste" (translates to "Mother Superior" of a monastery) and thought to ourselves: "What would she say if her website went down? Oh Dear!"
minimalist phone: creating folders
@mattiasgeniar I think I would working in this team LOL :D
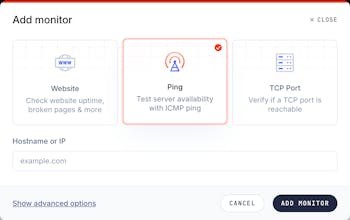
Looks solid, but curious—how does your TCP checks handle false positives from transient network spikes? IMO that’s the hardest part in real monitoring.
Oh Dear!
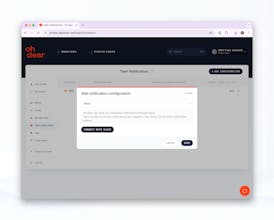
Hey @cyrusandrew , good question! Downtime is always independently verified from 2 different locations (using 2 different datacenters/regions). A problem needs to be confirmed before we alert on it. And as a user, you have the flexibility to get notified after 2 minutes of continuous downtime (our default), or 1 minute, 2 hours, ... you're free to configure this to your liking.
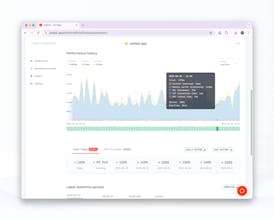
And for the performance alerts, we always look at the average of the last 15minutes of performance data, so any one-off outliers won't impact these alerts.