
ChartMogul
Unlock the full revenue potential of your SaaS business
•38 reviews•1 shoutout•186 followers


Launched on January 11th, 2024

Launched on May 31st, 2022
Launched on October 15th, 2020
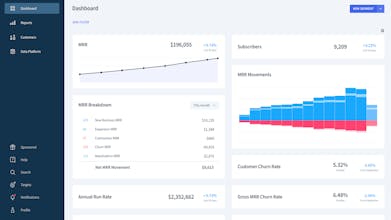
ChartMogul Benchmarks shows you what good growth rates looks like for SaaS companies, with the option to overlay your own SaaS metrics to compare your company with the rest of the industry. Based on the real revenue data of over 2,500 SaaS companies.


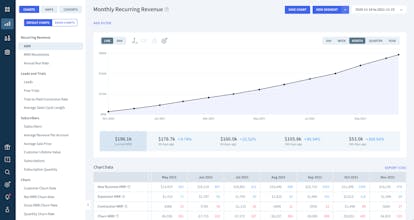
Great UI/UX. Unlike nearly all other SaaS KPI analytics / reporting tools, CharMogul tracks subscription quantity (i.e. users), discounts, CMRR, and allows you to export a MRR per customer by month excel file. Other great features include: MRR editing, subscription connecting, flexible segmentation, and tagging. That being said, there are three major draw backs, both of which are not insignifcant: 1) ChartMogul's numbers rarely ever tie to that of Stripe's; 2) pricing is usage based which means the more you grow, the more you pay, and 3) fairly unresponsive and hands-off customer support. If they could fix the first and improve the third, this would be a near perfect SaaS analytics tool.


