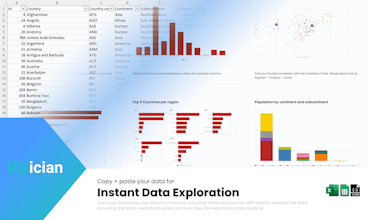
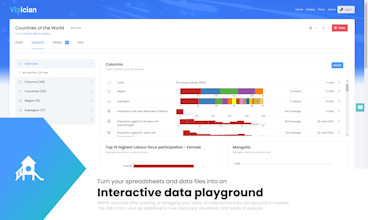
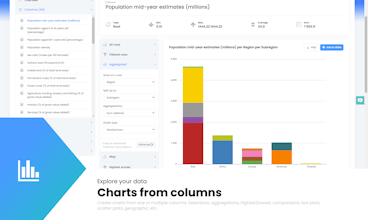
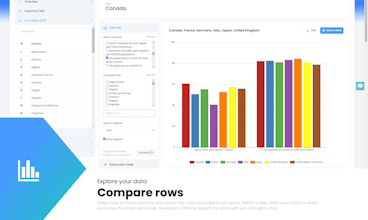
Copy and paste your data from Excel (or any other file/table) and Vizician will instantly visualize the data, providing the most used charts, plots, and overviews to explore the data. Let's turn your static data into an interactive data playground!
Hi all 👋,
I'm Jasper, the maker of Vizician. I'm really exicted to introduce Vizician to you.
You really should take a look if one of these use cases sounds familiar:
Data user/scientist/enthusiasts
You're getting a new dataset and want to get a feeling of what's in the data:
- Use Vizician to copy/paste or drag/drop your data, you'll get all charts, plots and overviews you'll need to explore the data. Without a single line of code, pivot table or library.
- Browse through all columns, rows and selections to get a feeling of the story in the data.
- Use your current tools & libraries to create a stunning data visualisation
Data owner/Data publisher
You want to publish/share your data and engage your audience:
- Use Vizician to provide a complete interactive data playground to your audience with a single click.
- Users can browse through all columns, rows and selections to explore and download the data
- Provide a guided walk-through your data, using interactive 'slides'
Try it now! It's free, and all data stays locally on your device.
Let me know how you would use Vizician!
Best of luck 👍. Super cool product. Congrats on your launch 🚀. Please keep us updated ❤️. If you need feedback on any specific item (e.g. landing page, design, functionality, etc.), feel free to get in touch on my Twitter or LinkedIn.
Vizician
YeyPin