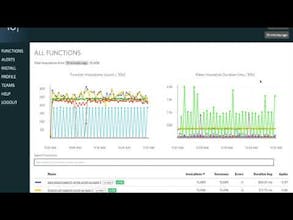
Co-creator here. We were building serverless applications and found that there was a major lack of visibility and instrumentation when it came to debugging complex functions in AWS Lambda, so we built IOpipe to address these issues.
Some highlights:
• Supports AWS Lambda functions written in node.js and python
• Requires no AWS credentials
• A bird’s-eye view of all your functions
• Get alerted in seconds when functions are misbehaving
• Debug deeper with single invocation views
* Investigate performance bottlenecks with tracing and profiling.
I'd love to know what you think of the concept. Get in touch at hello@iopipe.com if you have any specific needs.
Thanks!
@sboak thanks!
Tracing is pretty straight forward. You start by adding the tracing plugin (node only for now), and then simply add mark.start(foo), and mark.stop(foo) around blocks of code that you want to measure the performance of. IOpipe will do the rest, and graph the calls tracked in the invocation view in our dashboard.
Here's a full writeup on tracing: https://read.iopipe.com/tracing-...
Great Adam! Big fan here and IOpipe provided great insight into our Lambda stack. We since pared back from Lambda (for various reasons) but I’d definitely always instrument anything we do use with IOpipe.
IOpipe
The Pitch Room - Ep. #4
IOpipe
IOpipe