Whaly

Reporting made easy

1 follower

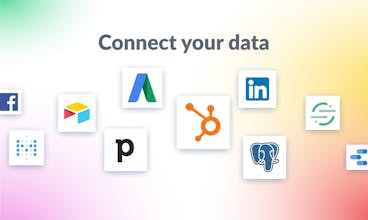
Whaly 🐳 is a no code business intelligence platform directly connected to your everyday tools: 🧸 Build metrics without writing SQL 👯‍♀️ Top notch access control and collaboration 🤖 Actionable charts that allow you to drill down the data
Whaly gallery image
Whaly gallery image
Whaly gallery image
Whaly gallery image
Whaly gallery image
Payment Required
Launch tags:
AnalyticsSaaSNo-Code
Launch Team

What do you think? …

Benjamin cambier
Mansa has been one of the very first customer of whaly.io ; we could not be more happy ; the team has been dedicated so much time & care for us. Don't hesitate to reach out to them! #firstcustomer
Florian Buguet
Thanks @jbenjamincambier 🙏🙏🙏 indeed Mansa has been our very first customers and we're happy to keep on building with you today!
Em. Sanchez
Hi dear hunters! First, thanks a lot @katmanalac for hunting us! I’m Emilien, CEO and co-founder of Whaly, super excited to launch on PH today. 🐳 What is Whaly: Whaly allows any business team to create their own reporting from the tool they use everyday without having to involve their engineering teams. Whaly solves several pains such as: Having your data always up to date Combine your data without coding Granular control of who has access to what data and metrics ❓Why we are working on this: In our previous companies my cofounders & I noticed that no tools were dedicated for business teams to create their own reporting. The available data tooling would always be focused on helping engineering create great machinery. All this engineering tooling was very complex to operate for business users who are more used to spreadsheets. After months of iterations, we built the first business intelligence platform for business teams, entirely no-code. What problem does it solve: No business teams should solely rely on their engineering team to get their reporting done. 🤖 Use Cases: Marketing teams -> centralize their marketing reporting into one comprehensive tool. Sales teams -> instant overview of their deals pipelines and conversion rates Executive teams -> track their key metrics Finance teams -> keep track of their forecast vs actuals CSM teams -> pulse on their most engaged vs churning customers Our current customers are either coming from the spreadsheets hell or complex engineering setup, and we’ll be happy to count you in as well.
Soham Sharma
This seems like an inbuilt mini Tableau for reports. Awesome product Team Whaly way to go. Looking forward to playing around with it.
Pierre de Poulpiquet
@soham_sharma You got the idea! To go deeper, we prefer Looker over Tableau, we think that the real pain is about data governance and collaboration which is what Looker nailed, while Tableau is for people that want to put a great amount of care in how their dashboard are looking =)