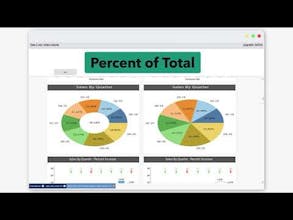
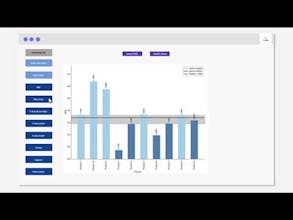
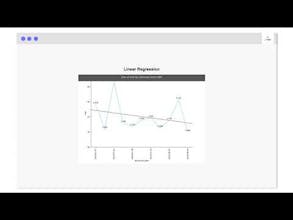
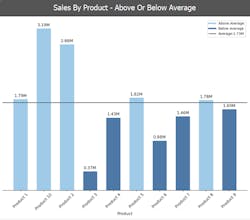
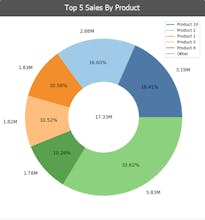
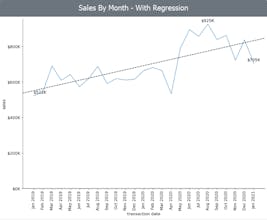
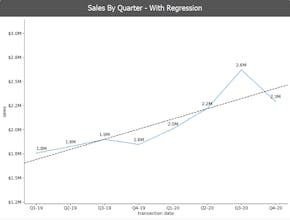
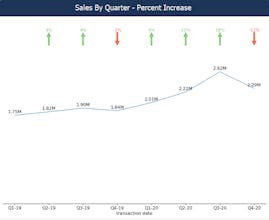
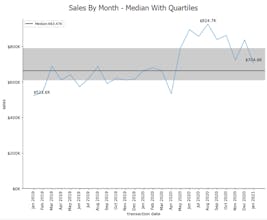
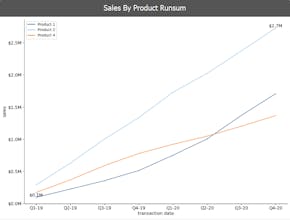
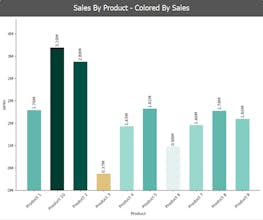
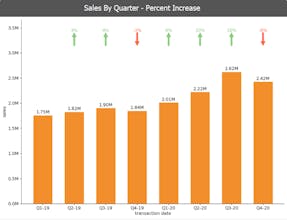
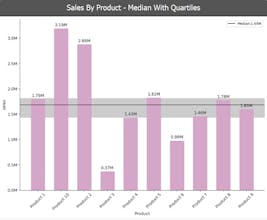
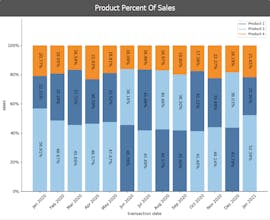
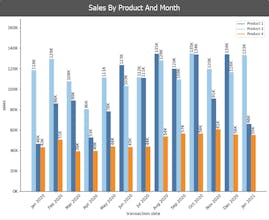
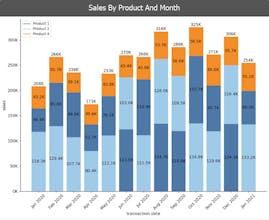
VizPick is a Business Intelligence tool for beginners and time restricted executives! It automatically produces 10-20 insightful, relevant graphs based on the user’s selections. Even employees with zero experience or know-how can find insights in your data!
Hey Everyone! I'm Brian, the creator of VizPick Beta. As a prior Business Intelligence Analyst by trade, I served many front-line workers, managers, and executives that were afraid to work with their own data. Only 30% of the workforce is comfortable with their data literacy. This software helps people analyze data and share valued insights by removing these common barriers to entry:
1) Tools are complicated and difficult to learn
2) Not confident transforming data
3) Not sure where to start
4) Embarrassment by the quality of visualizations they produce
VizPick aggregates data and presents the user with 10-20 relevant graphing options at one time. The graphs are pre-formatted to look great and include common business statistics like:
Average Comparisons
% Increase
Trend Lines
Rumsum
% Of Total
Median Comparisons
more coming!
There's nothing to learn, just pick the graph that speaks to you and share it with your team!
I would love to hear your thoughts and opinions as we continue this mission to make organizations data-driven at every level of the business!
***Sorry, Windows only for now!
Great work, @brian_sizemore! This is an awesome tool for quickly making professional looking graphs. It has enough flexibility built in to tweak it pretty much however I want.
GitNoter
VizPick
VizPick
Modern CSV
VizPick