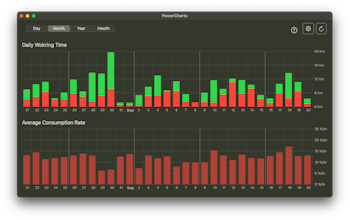
Visualize mac's battey usage and battery health using different charts. Battery levels, consumption rates, maximum capcity, level distribution... All presented to you on different time scales so you can know your mac better.
Hi everyone, I made this app to record mac's battery data and visualize it with chats.
I made it because I was kinda paranoid about my mac's battery life and battery health when I bought it last summer. Apple said it could last 15 hours but I didn't believe them. And the battery health dropped a bit fast.
So I wrote a script to record my battery data and made this app to present the data. It calculates consumption rate so I can easily know the battery life. For example, if it is 12.5 %/hr, then the full battery can last 8 hours at this rate.
It also shows your battery health data like how the maximum capacity and cycle counts have changed over time. I heard of the 20-80 rule which is keeping your battery levels between 20% - 80% could improve battery health, so there is also a chart to show your battery level distribution.
The data is presented on different time scales. You can see detailed information of last 7 days, or daily average data of last moonth, or monthly average data and health data of all time.
There is a disadvantage though which is that the user have to add the contab tasks themselves. Because it uses crontab tasks to record the battery data periodically, and third party apps are not allowed to edit crontab tasks. I try to make it as easy as possible. All you have to do is to copy a command and run it in terminal. And the scrips are open sourced on Github so it is safe (the app is also completely offline). But still, it is a little inconvenient.
This is all I want to share. If you also want to try it, there is a free lite version in App Store `PowerCharts - Lite`. Thanks ;)
@tedlex Congratulations on the launch of your app! It's impressive how it visualizes battery usage and health, giving users valuable insights into their Mac's performance. Have you considered adding automated crontab setup in future updates to make it even easier for users to get started?
@tedlex Good job! Recently, my computer's battery drains quickly, and I happen to need a tool to check the battery status to see if it needs to be replaced. A small suggestion: you may consider prompting users to replace the battery based on their current battery health, or providing some maintenance tips :)
@tedlex Love the depth of data visualized here! One thing that stood out is the need to manually set up crontab tasks, which could be tricky for less tech-savvy users. Have you thought about offering a more user-friendly setup process, like a one-click solution for the terminal tasks? I think it could lower the barrier for a lot of potential users who might shy away from the command line.
Hey Ted,
Does PowerCharts provide any recommendations or insights based on the data it collects? For example, does it suggest optimal charging habits or flag potential battery issues?
Congrats on the launch!
@kyrylosilin Thanks for the question! The purpose of the battery level distribution chart is to remind user about the 20% - 80% rule, but other than that it does not have recommendations. Maybe I can look into this more and think of some new features ;)
I love it when users out there create productivity apps and tools generally for Mac users for a better UX. Massive respect, especially when Apple torments you with it's tedious processes to publish an app on its platforms 👏👏👏
PowerCharts
Picture Picker—Collect,Create,Edit Image
PowerCharts
PowerCharts
Telebugs
PowerCharts
PowerCharts