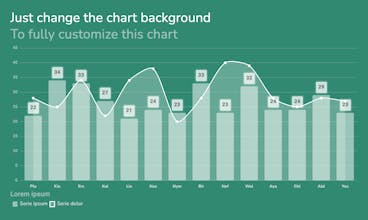
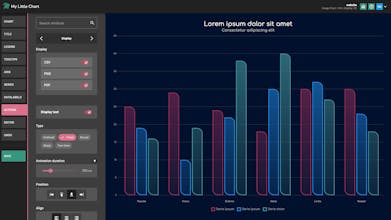
Thanks to an intuitive interface our application is accessible to everyone, even users with no programming knowledge. We provides a wide range of customization with more than 275 parameters that allow you to create graphics that reflect your style and needs.
We believe that well-designed charts can effectively communicate ideas and information, and our goal is to make this tool accessible to everyone.
Test My Little Chart for free during the Beta phase then take advantage of the early adopter offer when the final version is released.
A quick overview of our main features:
275+ parameters
9 chart types
100+ templates
45+ functions
900+ fonts (from Google Font)
Event triggers
Responsive charts
4 designer modes
3 download modes for your users (PDF, PNG and CSV)
White labeling (no watermark)
99.5% uptime and 24/7 monitoring
Choice of server location* (Frankfurt - Germany, New York City - United States or Singapore)
*during Beta only Frankfurt is available, you will be able to migrate your account after the Beta phase.
@britt_joiner
Hello Brittany,
Currently, live data connection is possible outside the editor. You can embed the graphic in your web application or site via an iFrame and then pass your data to it via the URL or via a message (iframe.contentWindow.postMessage).
You will find a complete example on CodePen here: https://www.mylittlechart.com/#r...
Do not hesitate if you need more details or explanations.
Gregory
My Little Chart
Trello Tip Generator and Newsletter
My Little Chart