fnchart

fnchart

facts in context

140 followers

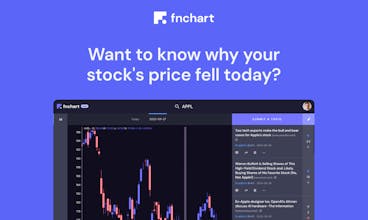
Want to know why your stock's price fell today? Just check the fnchart! We built fnchart to answer the question "what happened?" We do this by aggregating financial news, adding user generated discussion and voting, and map it onto a stock chart.
fnchart gallery image
Free
Launch tags:
FintechInvestingMoney
Launch Team

What do you think? …

Roman Goldmann
fnchart is basically: Stock Chart + Reddit == facts + context. We then build on top of that a whole new way to navigate historical posts, so that you can actually look and interact with a stock chart by pulling up news & discussion from any time in the history of the stock. Use-case Scenario: You're interested in stock AAA, but you notice on the chart that it fell 30% 2 years ago, and hasn't begun recovering yet. But today you read that they are embarking on a big turn around plan. So you click on the time period on the chart 2 years ago to find out what the cause of the drop was. You find out it was a critical supplier that went bankrupt, and they have only now found a replacement. Now you can decide whether to buy their stock or not, and you are informed about the context. We are a team of 5 (4 coders and 1 graphics designer). This has been an absolute labour of love for all of us on the project. We have always believed that most people completely miss the context behind movement of stock prices. We wanted to build this platform to not only put stock price movement in context, but also to provide far richer depth of information. Most importantly we wanted to allow all of us to interact together and add further context to articles in the media. Our inspiration was when we would browse reddit and come across a sensationalized news article. We would then read the comments on reddit and often find an actual expert in the field that provides amazing context, and creates an amazing learning opportunity--something the news article completely failed at doing. We want to bring this experience to the specific focus of financial news. We also hope that financial journalists take advantage of our platform to discover story ideas, and to be able to use our direct messaging to reach out to experts directly, to get further details on a possible lead. In the future we will also allow users to see levels of engagement on various posts, so a journalist can get a sense of how popular a topic is before committing to write a full story on it.
Roman Goldmann
@shivam_tiwari24 Thank you, and may the wind be at all our backs in our future launches !
Chris Mcmonagle
I also just launched today so congrats to us both. fnchart looks great. I can see when this is very polished it will also help identify areas of strange market behaviour. Awesome idea.
Roman Goldmann
@chris_o4 Hey Chris, congrats to you and everyone that helped you get to where you are!
Janis Wilczura
Can you tell me how would you differntiate from Stockwits? They are long established, have thousands of users and it feels pretty much the same at first glance.
Roman Goldmann
@janis_wilczura Great question ! Go to fnchart.com and try it out and you would understand within 2 minutes what we have built. You don't need to register or anything. Stocktwits is to twitter what fnchart is to Reddit. So I could ask you, what is the biggest differentiator of reddit from stocktwits? Stock twits is basically: Stock Chart + Twitter. fnchart is basically: Stock Chart + Reddit. We then build on top of that a whole new way to navigate historical posts, so that you can actually look and interact with a stock chart by pulling up news & discussion from any time in the history of the stock. Here's a scenario: You're interested in stock AAA, but you notice on the chart that it fell 30% 2 years ago, and hasn't begun recovering yet. But today you read that they are embarking on a big turn around plan. So you click on the time period on the chart 2 years ago to find out what the cause of the drop was. You find out it was a critical supplier that went bankrupt, and they have only now found a replacement. Now you can decide whether to buy their stock or not, and you are informed about the context. We have also a number of tools that are far beyond what Stocktwits has: like our Market Sentiment Discovery Dashboard. Stocktwits is honestly just a twitter clone. When Stocktwits came out, it was because Twitter didn't support the $ hash, which is what was used for stock tickers. Twitter subsequently added that hash, and stocktwits has been struggling to differentiate themselves from twitter ever since then...
Janis Wilczura
@watr thanks for your feedback. A friend of mine was actually working on a similar solution years ago. Congrats for your release!
Roman Goldmann
@janis_wilczura You're most welcome! Thank you for engaging with us on our page! What happened to your friend's efforts, if you don't mind me asking?