

Draxlr
Turn SQL Data into Decisions
176 followers
Turn SQL Data into Decisions
176 followers
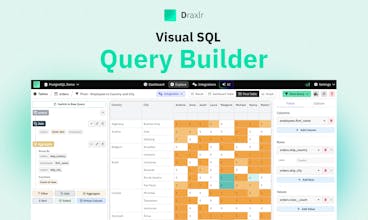
Draxlr is a tool to analyze and monitor your data. It can help you get answers from your database, without writing code. These answers and insights can be shared with your team and customers. You can build graphs, charts, and dashboards and share them as links, images, or embed them on your website and app. Not only that you can set up monitoring on your data, so if any data changes you can be alerted via Slack and Email.


Draxlr
Hello Product Hunt family 👋
We’re excited to be back, and this time, we’ve brought AI with us. This one’s smarter, faster, and more useful than ever.
When we first launched Draxlr, our mission was simple:
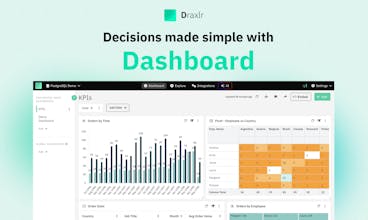
Help teams explore their SQL data and build dashboards.
And it worked. Teams used Draxlr to:
📊 Build dashboards,
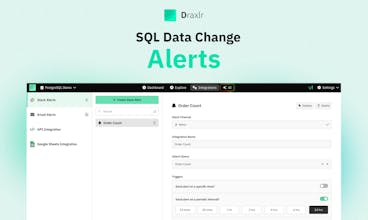
🔔 Set alerts,
🔗 And embed live dashboards across their tools.
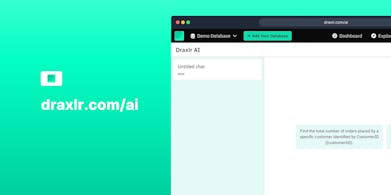
Then, we introduced Draxlr AI, enabling users to interact with their databases in natural language.
That was a big step, but we knew we could do more.
Over the past months, we’ve rethought the experience with one goal in mind:
Reduce friction between your questions and your data’s answers.
Here’s what’s new:
⚡ Even faster, more accurate AI SQL generation.
📊 Chart-based responses that flow directly into dashboards.
🔔 Smart alerts and embeddable outputs.
We’d love for you to try it out, share your thoughts, and help us shape what’s next.
— The Draxlr team
Draxlr’s AI-powered SQL tool truly simplifies data analysis—chatting with your data in plain English and instantly getting optimized queries and dashboards is a game-changer. Loving the faster UI and smarter AI that speed up turning questions into insights!
Draxlr
@supa_l Thanks for the support.