Chartbrew

Chartbrew

One dashboard to view, create and share your data

5.0
2 reviews

245 followers

Gather all your data from your databases and services into one real-time dashboard. Connect and get data from your APIs and databases (MongoDB, MySQL, PostgreSQL & more coming soon).
This is the 3rd launch from Chartbrew. View more
Chartbrew v3

Chartbrew v3

Create connected client reports effortlessly
Chartbrew is an open-source client reporting platform. The reports can be connected to multiple sources at the same time and Chartbrew supports connections to various databases, Firestore, Realtime Database, APIs, and more. Featuring client accounts as well.
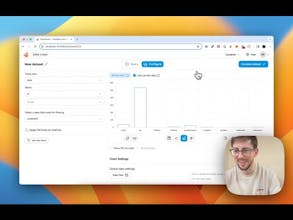
Chartbrew v3 gallery image
Free Options
Launch Team

What do you think? …

Razvan Ilin
Hey folks! Chartbrew v3 has been in the works for a while and it feels great to finally share what I've been working on! Let me know me know here if you have any questions. Happy to go through each one of them ✌️ Now let's see what this new update is about! What's Chartbrew Chartbrew is an open-source data visualization platform. You can connect your data sources to create dashboards and client reports to share or embed on other sites. V3 presents a major shift towards client reporting with focused features such as client accounts, sharing, embedding, and customizing the reports. What's new in v3 ✨ New UI and components The new update comes with an overhaul of the entire UI making the usage more fluid, and consistent, as well as adding more components to make life easier such as Autocomplete fields when dealing with many options. The update features new pages for previewing datasets and a brand new connection wizard too. 🍃 Reusability at the core The entire architecture was changed to allow users to create data source connections and datasets that can be re-used across all dashboards. Together with templates, users will be able to replicate dashboards with ease. 🎛️ Dashboard layout was completely redone The new layout lets users drag and drop charts around the dashboard, as well as change the size (width and height). The layouts will be different for each screen size and users have complete control over how it looks. 👯 New client roles The new update introduces new roles too. Chartbrew now has team-based roles as well as client roles. Clients can be invited to view and/or edit selected dashboards without interacting with others outside their scope. ⬆️ And lots of other updates since releasing v2 - Email & Slack alerts for milestones, thresholds, and anomalies - GA4 support - Strapi integration - KPI goals with progress bars - Dashboard-level date filters - Dashboard timezones - TimescaleDB integration - Dataset joins ...and much more I'll be here in the comments if you have any questions. If you want to give Chartbrew a try, don't forget to use code CB20PH for a 20% discount. The code expires at the end of the month, so go grab it now! - Raz ✌️
Razvan Ilin
@meryem_ghazi Thanks for checking Chartbrew out, @meryem_ghazi 🙌
Felix Scholz
@razvanilin Congrats on launching v3, Raz 🥳
Razvan Ilin
@fscholz Thanks Felix! 🙏
Sander Visser
You're killing it! Awesome to see v3 come to life 🔥
Razvan Ilin
@fishsander Thanks Sander! It was quite the work to get it to this stage, but glad to finally release it in the wild 🚀
Garen D Orchyan
Good job, big congrats on the launch ❤️🚀
Razvan Ilin
@orchyan Thanks Garen! 🙌