Canopy Charts

Canopy Charts

Visual editor for building beautiful, dynamic charts

5 followers

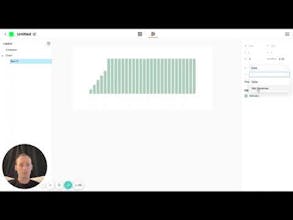
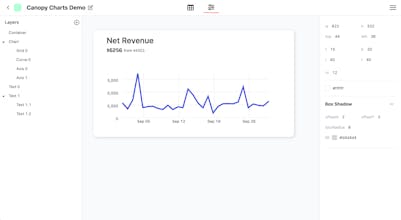
Canopy Charts provides a visual editor for quickly building and customizing beautiful charts. The charts can be embedded in a live app like a React app, or any web page by using an iframe. The charts are powered by live data from a variety of sources.
Canopy Charts gallery image
Free Options
Launch Team

What do you think? …

Yehuda Zahler
Super excited for you Matt! Congrats on the launch!
Matt Roll
Hi Product Hunt! 👋 Thanks for checking out Canopy Charts :) My goal for this tool is for it to be the fastest and easiest way to create beautiful data visualizations for the web. My experience building custom charts for various products taught me that even the state of the art in JavaScript charting libraries leave a lot to be desired. I was able to see that a visual editor could take advantage of the flexibility of the best charting libraries, abstracting away the need to write code, but keeping the flexibility of being able to render dynamic data from a data source like Google Sheets or even your company's database. I'm super excited for you to try out Canopy Charts, and would love to hear any and all feedback you have for me about any part of the product or experience so far! Wishing you all the best, Matt Roll
35gcs
let's gooooo. congrats matt, pumped to try this